
Team Check up room set up:

1. After the team rates the team check up you can show the aggregated results using 9 charts like this:
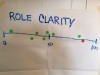
2. You can identify the leader of the team’s ratings by using a different colored dot:
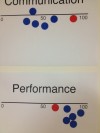
3. Once the data is aggregated in this way, you can begin with general observations about the distribution or the difference in the leaders view of the team versus the team’s view.